If I was to ask you what you do, I’m sure you could provide an answer. Most people lead with a title–“I’m an engineer working on software systems,” or, “I’m a senior marketing manager that drives marketing initiatives for our products.” Fair enough. That’s a reasonable answer.
A much harder question is “Why?” Why do you do what you do? More specifically, why does it matter to the company you work for?
I think there’s a gap (sometimes a significant one) between the work we do and why it matters. I know a lot of people who will be working on a task or project and wonder aloud, “Does this even matter? Why am I doing this work?” That’s a scary thing. Talented people working on stuff that doesn’t connect to a clear purpose or meaning won’t leave you with happy, fulfilled employees. It also won’t lead to a successful business.
Part of the challenge is that a lot of companies struggle to explain and sell their vision internally. Some might not even have a real vision. Without a vision or higher purpose, or one that’s well understood by everyone, people start to meander in their jobs or get lost in the minutiae that doesn’t add real value.
But even with a well-understood and transparent vision, it’s not always obvious how work being done “in the trenches” translates up. And this is where I believe data helps. Data is the common language that everyone in an organization can and should be able to speak. Data should cut through the noise, politics and tensions that exist in companies (including small and scaling startups) and provide a way for people to understand each other and make better decisions.
Data either validates or invalidates the work we’re doing as having meaning. If you can’t tie the work you’re doing through data to a metric that matters for the business, you have to really question the point of doing the work. You should be able to–as much and as often as possible–draw a fairly direct line from what you’re doing, and what you’re tracking metrics-wise, to the business on a whole. To do that you need to know what to track on a project-by-project basis, and you need some top level metrics as business health indicators.
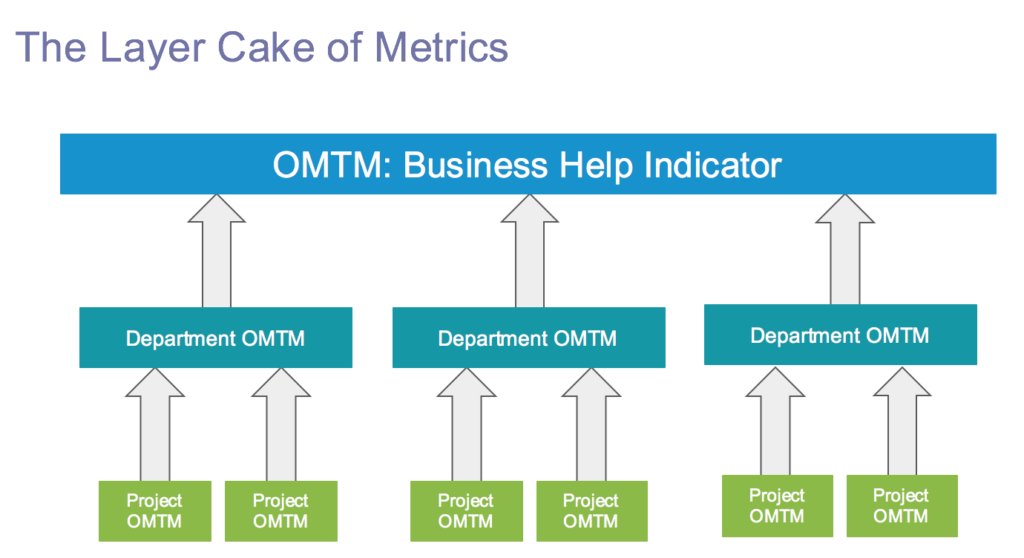
Recently I’ve been using this simple diagram to explain this idea:

The idea is that project-based metrics (the One Metric that Matters at a project/task level) bubbles up to a metric that matters for your department/group (the OMTM for the department/group), which further bubbles up to a business health indicator (the OMTM for everyone). If you can draw those lines, you’re in good shape, because you can measure the work you do against nitty gritty targets, but also against the higher purpose for the whole organization. As a result your work will have more value and meaning to you and to your company. Without that, you fall into the trap of “doing work for the sake of doing work.”
Everyone in your organization needs to be able to “speak data.” If the data is too complex, or inaccessible, then it becomes “dark magic that some people in the back corner work on”–no one wants to trust it, rely on it or leverage it properly for true value creation. If everyone in your organization speaks data, we suddenly have a common language that transcends departmental and organizational boundaries. Marketing can speak to sales. Sales can speak to customer support. Customer support can speak to product management. And so on.
Data not only helps us figure out what to do, but it helps us understand why we’re doing it. Data plays a key role in providing us with insight into where problems and potential solutions exist, but also in motivating teams, driving internal engagement, increasing communication and collaboration and keeping everyone focused on what really matters.
Photo courtesy of JD Hancock
 Founding Partner at